
A ROAS of 8. Sounds brilliant. But if your margin on that product is 11%, you lose money on every sale that campaign drives. That is the trap plenty of eCommerce brands sit in right now, and it is exactly why POAS exists.
If you are an eCommerce founder or a marketing manager steering Google Ads on ROAS targets, this POAS vs ROAS comparison is for you. ROAS measures revenue. You want profit. Those are not the same thing, and the gap between them is where budgets quietly bleed.
In this article we explain what POAS (profit on ad spend) means, why ROAS misleads you the moment your margins vary per product, and how the maths works with one clean worked example. Then we walk through implementation step by step: margin data in your feed, profit as your conversion value, and translating your tROAS into a profit target.
After reading, you will be able to:
- Calculate POAS for your own campaigns
- Work out your breakeven ROAS from your margin
- Send profit data to Google Ads as the conversion value
- Set a tROAS that functions as a POAS target
No theory without numbers. We do all the sums for you.
What is POAS?
POAS stands for profit on ad spend: gross profit divided by advertising spend. Where ROAS tells you how much revenue each euro of ad spend returns, POAS tells you how much gross profit is left.
The formula: POAS = gross profit / ad spend.
Gross profit here means revenue minus the direct costs per order: cost of goods sold (COGS), shipping and payment fees. Fixed costs like staff and software stay out of the calculation.
The breakeven point for POAS is always 1.0. Above 1, a campaign contributes to profit. Below 1, you spend more on ads than those ads return in gross profit. That is the quiet superpower of the metric: you never need a benchmark to know whether you are losing money.
Why ROAS lies when margins are mixed
ROAS optimises for revenue, not profit. As long as every product carries roughly the same margin, that is fine. The moment margins vary meaningfully across your catalogue, ROAS becomes an unreliable steering metric.
Judging campaigns on ROAS is like judging a restaurant on full tables. POAS checks whether the kitchen actually makes money on each dish.
The underlying maths: your breakeven ROAS is 1 divided by your gross margin. At a 22% margin, that is 1 / 0.22 = 4.55. Every campaign below ROAS 4.55 costs you money, however green the dashboard looks. At a 50% margin, breakeven sits at ROAS 2. Two shops with identical ROAS figures can be in completely different financial shape.
Smart Bidding knows nothing about your margins unless you tell it. If you optimise towards a target ROAS with revenue as the conversion value, the algorithm shifts budget towards high-revenue, low-margin products, because those hit the revenue goal most easily. You see this effect clearly in Performance Max campaigns, where the algorithm has the most freedom.
POAS vs ROAS: the comparison table
| ROAS | POAS | |
|---|---|---|
| Formula | Revenue / ad spend | Gross profit / ad spend |
| Answers the question | How much revenue per euro spent? | How much profit per euro spent? |
| Breakeven | 1 / gross margin (differs per shop) | Always 1.0 |
| Blind spot | Margin, shipping and payment costs | Fixed costs (covered by targeting above 1) |
| Works well for | Uniform margins, lead gen, SaaS | Mixed-margin eCommerce catalogues |
| Data required | Revenue per conversion | Gross profit per order |
The worked example: same ROAS, opposite outcomes
Calculating POAS means dividing a campaign’s gross profit by its ad spend. One worked example shows why this reads performance differently from ROAS.
Say you sell a product for €100. COGS is €55, payment and shipping fees add €10. Gross profit per sale: €35, a 35% margin.
Your campaign runs at a ROAS of 4, which means €25 of ad spend per €100 of revenue. The sums:
- Gross profit per order: €100 – €55 – €10 = €35
- Ad spend per order: €100 / 4 = €25
- POAS: €35 / €25 = 1.4
- Left after ad costs: €35 – €25 = €10 per order
Healthy. The breakeven ROAS for this product is €100 / €35 = 2.86, so ROAS 4 leaves comfortable headroom.
Now a second product, also €100, but with €80 COGS and €8 in fees. Gross profit: €12. At exactly the same ROAS of 4:
- POAS: €12 / €25 = 0.48
- Loss per order: €25 – €12 = €13
Same ROAS, opposite outcome. This product’s breakeven ROAS is €100 / €12 = 8.33. If both products sell equally often, your blended POAS is (€35 + €12) / (€25 + €25) = 0.94. The dashboard shows a tidy ROAS of 4 while you lose €3 on every pair of sales.
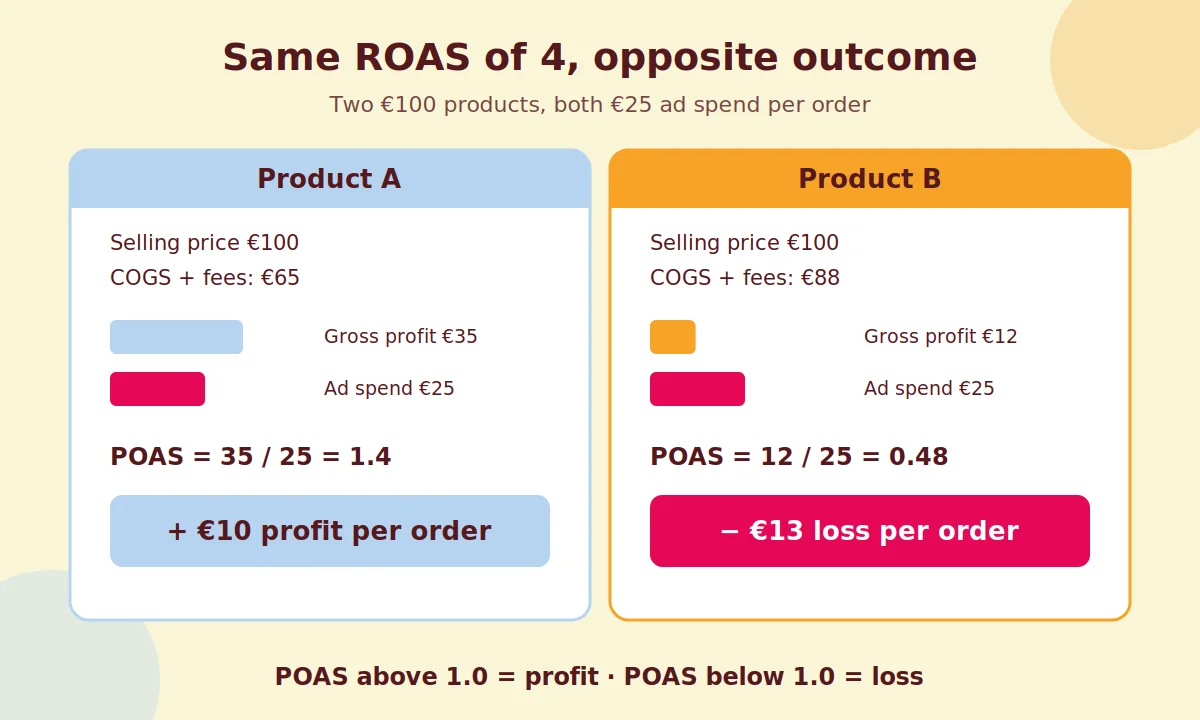
That is the whole argument in one example. ROAS 4 means nothing without the margin next to it. POAS gives you the answer directly.
Coby’s 4-Step POAS Setup
The fastest route to POAS bidding takes four steps: margins into your data, profit as the conversion value, translating your tROAS, then monitoring. We call this Coby’s 4-Step POAS Setup.
- Get margins into your data. Work out gross profit per product: selling price minus COGS, shipping and payment fees. In Shopify, fill in the cost per item field on each product. If SKU-level is not feasible yet, start with a margin per category. A good approximation you actually use beats a perfect one you never finish.
- Send gross profit as the conversion value. Instead of revenue, pass profit per order as the conversion value to Google Ads. This demands reliable measurement: with server-side tracking via GTM you stop losing conversions to ad blockers and browser restrictions, and on Shopify a GTM custom pixel gives you clean control over the data layer. For Meta, send the same profit value through the Conversions API.
- Translate your tROAS into a POAS target. Google has no “target POAS” button, and you do not need one. Once profit is your conversion value, your tROAS functionally becomes a POAS target. Breakeven is tROAS 100%. Want a POAS of 1.4, as in the worked example? Set tROAS to 140%.
- Monitor ROAS and POAS side by side. Keep both metrics in your reporting for the first four to six weeks. Revenue and ROAS may dip as the algorithm drops cheap, low-margin volume. That is the point. As long as POAS climbs, you earn more from less revenue.
Common mistakes when switching to POAS
Most POAS implementations fail on data, not on theory. These are the mistakes we see most often.
Switching with broken tracking. If you only measure 70% of your conversions, your profit signal is too noisy to bid against. Fix your Google Ads tracking problems first, then change bidding strategy. Unsure about your setup? Start by reviewing which server-side tracking tools fit your stack.
Calculating with net profit. POAS works on gross profit. Allocating fixed costs per order makes the calculation slow and debatable, and the algorithm gains nothing from it. Cover fixed costs by targeting a POAS above 1.
Setting margins once and never updating them. Purchase prices change, so do carrier rates. Stale margins misdirect your bids just as badly as no margins. Schedule a quarterly refresh of your margin data.
Panicking when revenue dips. After the switch, revenue often drops a little at first. It feels uncomfortable, but it is the algorithm shedding loss-making sales. Judge the transition on profit, not on revenue.
Waiting for perfect SKU data. Category-level margins are a perfectly good starting point. Refine towards SKU-level from there.
When ROAS is still fine
Honest answer: not everyone needs POAS. If your margins are uniform across the catalogue, or you run a lead gen model or a service business, ROAS (or a CPA target) remains a reasonable proxy for profit.
POAS earns its complexity back once margins vary sharply by product, category or customer type, and your campaigns touch products at both ends of that range. In eCommerce, that is the rule rather than the exception.
How Coby approaches this
At Coby Agency, POAS bidding starts with the data, not the bidding strategy. Tracking is the foundation of every campaign we run: without complete, server-side measured conversions carrying the right profit value, any POAS target is guesswork. That is why we always begin with a tracking and data audit before touching bid strategies.
That order of operations pays off. For OneMeeting (De Eenhoorn) we delivered a ROAS of 1,500%, and because the tracking was solid, we knew that number was real rather than a measurement artefact.
Marloes Slotboom, Coby’s founder, worked at Google as an Agency Account Strategist for the Benelux and Nordics before starting the agency. She has seen from the inside how Smart Bidding handles conversion values, and why the algorithm chases exactly what you feed it: feed it revenue and it hunts revenue, feed it profit and it hunts profit. POAS bidding is one of the services we build specifically for eCommerce clients, including the data layer that makes the signal reliable.
Conclusion: steer on what you keep
ROAS tells you how much revenue your ads generate. POAS tells you whether you earn anything from it. The moment margins differ per product, the second number is the only one that matters.
The route is concrete: margins into your data, gross profit as the conversion value, tROAS translated into a POAS target, and a few weeks of monitoring both metrics side by side.
Want to know whether your tracking is ready for POAS bidding, and what your current campaigns really contribute in profit? Book a free 30-minute call with Marloes and we will run the numbers together. More background reading lives on our blog.
Frequently asked questions
What does POAS stand for? POAS stands for profit on ad spend. It measures how much gross profit a campaign generates per euro of advertising budget. The formula is gross profit divided by ad spend.
How do you calculate POAS? Divide a campaign’s gross profit (revenue minus COGS, shipping and payment fees) by that campaign’s ad spend. If €2,500 of ad spend produces €3,500 in gross profit, your POAS is 1.4.
What is a good POAS? A POAS above 1.0 means a campaign generates more gross profit than it costs. In practice most shops target higher, because fixed costs still need covering after ad spend. The right target follows from your own cost structure, not from a benchmark.
What is the difference between POAS and ROAS? ROAS divides revenue by ad spend, POAS divides gross profit by ad spend. A high ROAS can still mean a loss-making campaign when margins are low; POAS shows that immediately.
Does POAS work with Google Smart Bidding? Yes. You send gross profit instead of revenue as the conversion value and set a tROAS, which then functions as a POAS target. tROAS 100% is breakeven, tROAS 140% corresponds to a POAS of 1.4. Reliable server-side tracking is a precondition.
Is POAS only relevant for eCommerce? POAS matters most where margins vary sharply per product, which usually means eCommerce. Businesses with uniform margins, such as SaaS or service companies, are generally fine with ROAS or a CPA target.
Written by Marloes Slotboom, founder of Coby Agency. Last updated: August 2026